In continuation of the previous blog post in our “Introduction to Data” series, we will also seek to build off of a blog post recently made by my colleague, Scott, wherein he discusses impact measurement. Scott’s post articulates many of the what’s and why’s to which we will now try to provide a “how”. So let’s dig in!
Supply and Demand
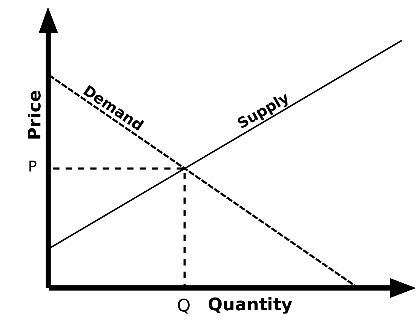
We don’t want to labor basic topics, though we do want to make sure we are all on the same page when we start. The basic explanation for supply & demand is that Agent A has an item that Agent B desires; a compromise of value is found and an exchange is made. This singular model is a basis for most market events. The spectrum of possible values become the supply & demand curves, respectively.
In action, we will want to ask ourselves: what does our organization supply? Scott alluded to the inverse of this: establish clear statements of desired outcomes. Service-sector organizations often fill abstract needs, using ambiguous “supply chains” to fulfill those needs. To counteract this abstraction we want to build a framework wherein answers can be “nurtured”. We use the term “nurtured” because data is subject to interpretation in many ways; we nurture data so as to be aware of our bias throughout the process. Our data will always be imperfect and only ever bring us halfway to our desired insights. By taking this more academic perspective we can better position minds to discern optimal procedures and workflows in our nonprofits.
Choosing the right metrics and using your data
By mapping these data needs and flows, we can also see similarities in our data production chain. Are there metrics, or derivations of metrics, that may be useful for more than one audience? Or are there similar data supply chains, that supply multiple metrics, albeit for different audiences? Using this information we can already begin to decide which metrics need to be prioritized, and which may have to wait. Though already, we are able to take action!
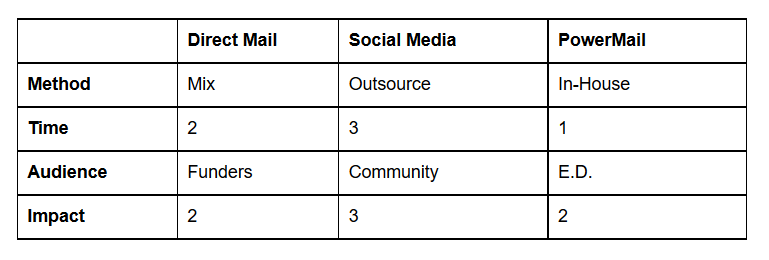
The chart above is an example of a rudimentary deliverable that can be made with the information we’ve already gathered and expanded. In this chart, I look at communication channels and break them down into four categories:
- Methods – how will your organization obtain the data? Is your organization able to gather and organize the necessary data in-house, or will you need to seek external assistance? This can be considered a measure of fiscal cost.
- Time – a relative assessment (i.e. 1-3) of how long it will take to gather the data and make it usable.
- Audience – signifies the data’s target audience. For whom is one trying to gather data? Is this to tell Volunteers/Community the impact they are having? Is the data for internal leadership? Or for a Board of Directors & larger funders?
- Impact – a projection of the effect the data is hoped to have. How important is this data to your organization? Do you feel that having this information will have a dramatic or minimal impact on your organization’s decisions?
By adding numeric value into the categories of Method and Audience, we can build a graph to help an organization prioritize next steps toward utilizing data. And while we might not be able to graph these metrics into an exact replica of a supply/demand graph, visually we can now compare the options available to our organization.
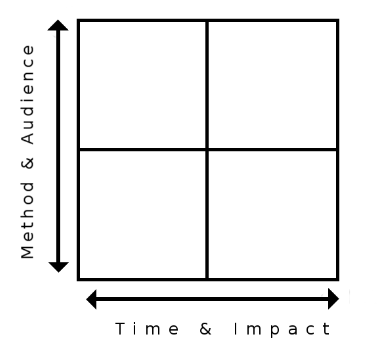
In economics, the term nearest to what we’ve created would be called “production-possibility frontiers”, which is the curriculum supporting the argument that “trade improves all lots.” The most immediate question being answered is: what can your organization obtain in-house, and what tasks ought, or need, to be outsourced?
Next steps
Not that we have exhausted the lessons economics has to offer, but in our next post we will seek to focus on statistics. After that, we’ll tie these themes together, and hopefully leave you with a better sense of how it can all be applied to the optimization of any process an organization might choose to pursue. While the internet is over-saturated with data and comprehensive plans that promise success, the goal here is to see how the use of fundamental ideas can have valuable impact on organizational planning and success.
[Caveat: There is a single rule that pervades all academic studies in both economics and statistics; a single answer, actually, to any and all questions: it depends. As frustrating as this answer may be, it is a good reminder that success only often comes after failure, and that in order to succeed one must first try. Much of what will follow you may already know; my hope is to enable you to apply these things you already know to your own organization and workflow. Below are a few articles that elaborate on this exact conversation.]
Further Reading:
https://www.bloomberg.com/view/articles/2016-06-10/economics-struggles-to-cope-with-reality
https://sites.google.com/site/kocherlakota009/home/policy/thoughts-on-policy/6-12-16
http://www.economist.com/news/finance-and-economics/21707529-no-holds-are-barred-paul-romers-latest-assault-macroeconomics-emperors


 thedatabank, gbc is technology for change, and we walk the talk.