The Almighty Open Rate
All nonprofits need and want to communicate with their supporters, but when it comes to email, there is one thing standing in your way – the inbox. In the world of email statistics, we all worship at the altar of the open rate. While open rate isn’t completely indicative of overall engagement with your mailing, it is the most ubiquitous statistic and applies to all types of mailings. Furthermore, the inbox is a very impulsive place – suggesting if you could just put the right combination of words in the subject line you could basically get something (opens) for nothing. Because of this, guides to increasing your open rate proliferate the net like ads for Viagra in your Spam box. Here’s a small sampling of Email Subject Line Best Practices summarized from other articles:
- Avoid the words percent off, reminder, and help.
- Frame your subject in the form of a question, like Jeopardy!
- Keep your subject line to 50 characters or less.
It’s always nice to get some quick tips from experts, but they seldom share the data behind their assertions. In this series of posts, we’ll look at some data to see what kind of effect these best practices have on open rates.
The Dataset
The data we’ll be looking at is from small to medium nonprofits who range across all nonprofit categories. The emails included all types from e-Newsletters to Fundraising Appeals to Meeting Invites. I have done some filtering of the data in order to get something more normalized. One of those filter steps is based on the correlation between the number of emails sent and the open rate.
List Size
In general, the more people you send the message to, the lower your open rate will be. This effect was very pronounced in the emails sent to 100-200 people where the average open rate was 28%. My first tip to increase your open rate: send it to between 100 and 200 people. I’m being facetious, but I decided to not include this subset because the average open rate was so different.
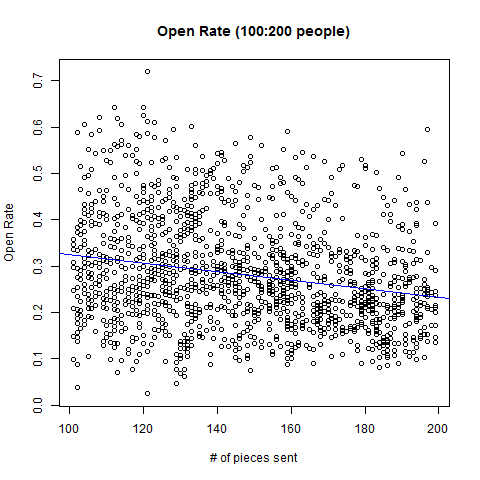
This was 6.5% higher than the open rate average of emails sent to between 200- 3500 people. As you can see though, there was a high degree of variance.
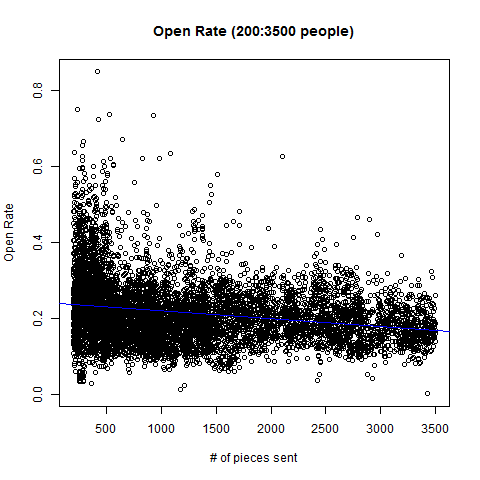
Descriptive Statistics For Sends in 200-3500 pieces Data Set:
Median # of Pieces Sent: 955
Mean # of Pieces Sent: 1243
Median % of Pieces Opened: 20.5%
Mean % of Pieces Opened: 21.5%
Adjust Your Open Rate For List Size
It’s easy to look at the above data and think, if I’m average, I should have an open rate of 21.5% – but that’s not true. Applying a linear regression to the above data set yields the following formula: (-.0000209*x + .241) * 100 = open rate where x is the number of emails sent for a nonprofit sending to between 200 and 3500 people. To put it another way, if you send your message to 3500 people you should expect an open rate of 16.8%. As an organization, don’t apply a one size fits all open rate. The more people you are sending to, the lower your open rate will be.
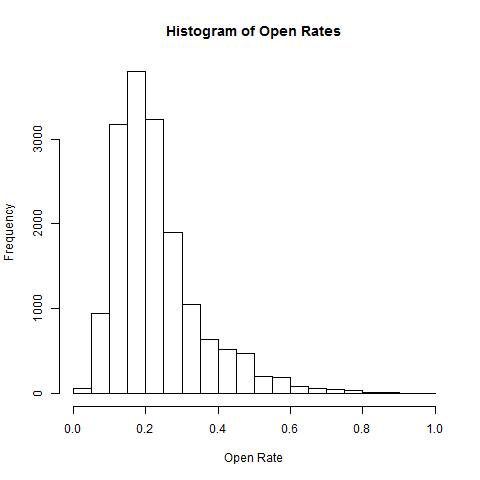
Skewness
Because we will be using this data for all further analysis, I do need to point out that the dataset is positively skewed in two aspects. One is in the number of pieces sent, meaning that there are more data points for the smaller sends. The other is in the open rates, although this skewness is slight.
In part 2 of the series, we’ll be exploring the 200:3500 dataset to see what effect those much touted subject line best practices have on open rates. Expect more graphs!
 thedatabank, gbc is technology for change, and we walk the talk.